
The Hidden Cost of Point-to-Point Integrations in ACCESS
At the beginning, connecting a data source directly to your product often feels like the most practical choice. One API, one transformation, and data flowing within days. Your team validates the idea, moves the pilot forward, and starts shaping the program.
Then a second source arrives. Followed by a third. Eventually, the program adds wearables, medical devices, laboratory results, or clinical data.
That is when the challenge changes.
Your team is no longer only building the product. It is also maintaining connections, resolving differences between sources, and addressing issues that repeat across every integration.
What worked for the pilot can become one of the biggest barriers to growth.
What matters most
A point-to-point integration can be quick to build but expensive to maintain.
The cost increases with every system that needs to receive, interpret, or use the data.
The problems do not stay within engineering. They also affect support, operations, dashboards, and reporting.
A unified data layer does not remove complexity. It puts that complexity in one place where teams can manage it more effectively.
Teams can migrate gradually, starting with the integrations that create the most work.
Direct integrations make sense at the beginning
Point-to-point integrations are not inherently a bad decision.
During a pilot, they can help teams:
Validate a data source quickly
Test a specific use case
Reduce the initial workload
Avoid making architecture decisions before enough information is available
Confirm that the integration creates value before investing more resources
The problem is not starting with a direct connection.
The problem is assuming that the same structure will continue to work as the number of participants, data sources, and teams depending on them increases.
One integration can be simple. Maintaining nine independent integrations rarely is.
Do not count sources. Count connections
When a team plans to add a new platform, it often thinks of the work as “one more integration.”
But a source does not connect in isolation.
It may also need to deliver data to:
The participant application
Clinical dashboards
The alert engine
Support tools
Analytics systems
Program reports
When every source connects directly to every system, the number of connections grows quickly.
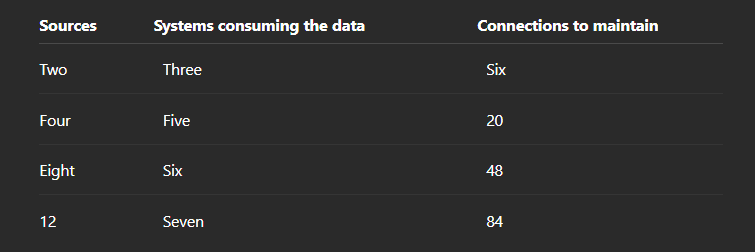
A shared layer changes that calculation.
Instead of connecting every source to every system, sources connect to a common structure. Downstream systems also receive data from that same layer.
In the final example, 12 sources and seven systems move from 84 connections to 19.
This is why each new integration can feel more difficult than the last. It does not start from zero. It inherits every dependency the program has already created.
An API is only the beginning
Connecting an endpoint is the visible part of the work.
Your team also needs to manage:
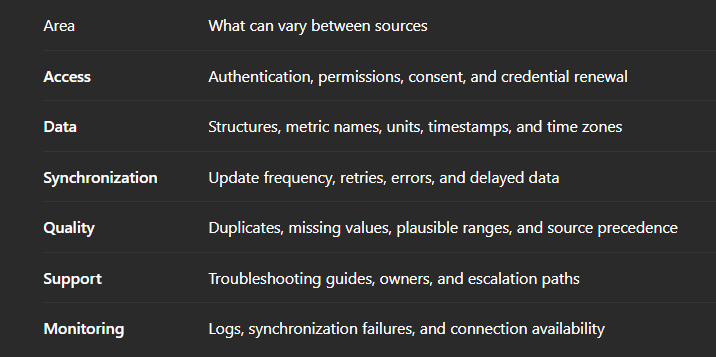
Teams need to build, test, and maintain each of these areas for every provider.
In our article on why wearable data is inherently messy, we explain why even devices that offer the same metric can produce data that is difficult to compare.
The steps example
Imagine that two platforms provide a metric called steps.
It appears to be the same data. However, each platform may handle it differently:
One platform provides a daily total based on the device’s local time zone.
The other provides records throughout the day, uses UTC, and may deliver data up to 72 hours late.
This can create unexpected situations.
A participant who changes time zones may end up with duplicate steps on one day and incomplete data on another.
A rule based on “7,000 steps per day” may evaluate different time windows depending on the source.
A report generated on Monday may show different results when regenerated on Thursday because one platform delivered delayed records.
These cases are not always bugs.
They are often the result of treating data as equivalent when the sources calculated it differently.
The program needs to decide how to handle timestamps, units, delayed data, and conflicts between sources. When every integration applies its own rules, multiple versions of the same metric begin to appear.
In how to standardize data from devices such as Fitbit, Apple Watch, and Garmin, we explain how a shared structure can reduce these differences.
Where the real cost appears
Maintenance never stops
APIs change.
Providers update permissions, authentication methods, structures, usage limits, and available metrics.
These changes do not arrive at the same time or follow the same rules. Each one requires engineering work, testing, and documentation updates.
Over time, the team may spend more resources maintaining existing connections than improving the product.
The true cost of an integration is not only how long it takes to build.
It is also how much work it needs to keep running.
Normalization becomes part of every integration
Every source forces the team to answer similar questions:
Which unit will the system use?
How will it handle time zones?
How will it identify duplicates?
Which source takes priority when two platforms provide the same metric?
How will the system distinguish missing data from a value of zero?
What happens when data arrives late?
When each integration answers these questions differently, dashboards, alerts, and reports also start requiring special rules.
Instead of using one shared schema, every team needs to remember how each provider behaves.
Support starts solving integration problems
When a participant stops sending data, the issue could exist in several places:
The device
Permissions
The application
The account
The connection
The provider API
The internal system
With independent integrations, support needs a different process for every source.
The team needs to know which permissions to review, how to confirm the last synchronization, which steps to recommend, and when to escalate the issue.
When most problems end up with engineering, the program does not have a scalable support process. It has a technical dependency.
This is one of the risks teams most often underestimate before launch. We cover it in what ACCESS Model companies need before go-live.
Reports start showing different numbers
Reports need clear definitions and reproducible results.
Without a shared structure, metrics such as active participants, connection rate, data completeness, or adherence may be calculated in different ways.
The problem becomes obvious when two teams present different numbers for the same reporting period.
Then the manual corrections begin:
Adjusting dates
Converting units
Removing duplicates
Reviewing missing records
Comparing numbers across dashboards
Explaining why two systems show different results
Every manual adjustment creates another opportunity for the next reporting cycle to produce a different answer.
We explore the connection between infrastructure and measurement in why the ACCESS Model needs standardized data and the ACCESS Model in digital health: from data to measurable outcomes.
Teams lose a clear view of the program
When every integration has its own logs, errors, and escalation process, answering basic questions can take too long:
Which source is failing?
How many participants are affected?
When did the issue begin?
Which data stopped arriving?
Who is responsible for resolving it?
How long has the issue remained open?
Without a shared view, teams often discover problems after they have already affected participants, workflows, or reports.

Ten signs that the architecture no longer fits your program
Mark the situations that apply to your program today:
Each new integration takes longer than the previous one.
Engineering spends more time on maintenance than on new functionality.
The same metric has different definitions depending on the source.
The team manually corrects data before generating reports.
Support escalates most issues to engineering.
Two dashboards show different numbers for the same metric.
A provider change affects several internal systems.
There is no shared view of integration health.
Adding a device requires changes to alerts and workflows.
The team takes too long to identify the cause of a data gap.
How to interpret the result
Zero to two signs: The architecture still supports the program’s current needs. Document data definitions before adding more sources.
Three to five signs: The cost is already visible. This is a good time to separate sources from the systems consuming the data.
Six signs or more: The architecture is limiting the program. Migration is no longer only a technical decision; it also affects product growth.
These signs do not mean starting with direct integrations was a mistake.
They mean the program has outgrown the architecture built for the pilot.
What changes with a unified data layer
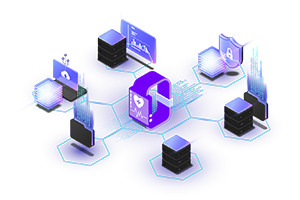
A unified layer sits between the sources and the systems using the information.
Instead of connecting every device directly to dashboards, alerts, and reports, the data moves through a shared structure.
This layer can help teams:
Connect different sources
Manage authentication and permissions
Normalize metrics
Convert units
Standardize timestamps
Validate data quality
Identify duplicates
Apply source-priority rules
Centralize errors
Deliver data through a consistent structure
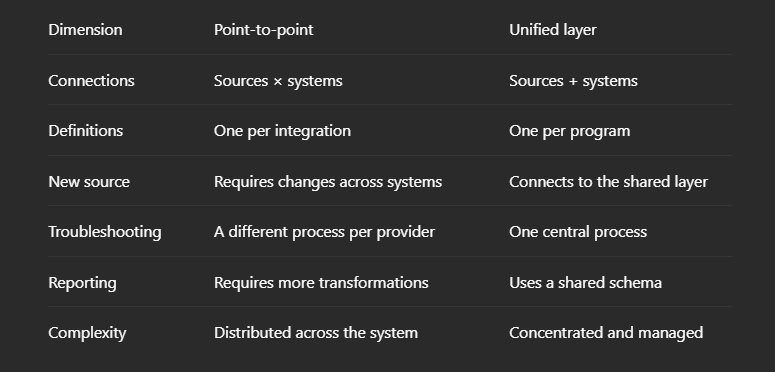
A unified layer does not make complexity disappear.
It puts that complexity in one place where teams can manage it more consistently.
This allows the program to add new sources without rebuilding every dashboard, alert, or report.
For a deeper look at this decision, read building or buying wearable integrations and how to integrate data from multiple wearables into one system.
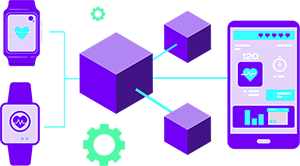
What to review before adding another source
Before approving a new integration, look beyond the estimated development time.
Connectivity
Which authentication method does it use?
How are permissions renewed?
What happens when the participant changes devices?
How is a disconnected source restored?
Who is responsible for reconnecting it?
Data
How does the source define each metric?
Which units does it use?
How often does it update information?
How does it provide historical data?
How does it handle missing or delayed values?
Quality
Which validations will the program apply?
How will duplicates be detected?
Which values are considered implausible?
Which source takes priority when conflicts appear?
Operations
How will support know that a problem exists?
Can the team detect it before the participant reports it?
What can support resolve without engineering?
Who will monitor the connection?
What is the expected response time?
Reporting
Does the source use the same definitions as current integrations?
How will it affect program indicators?
Which dashboards will need to change?
Will the results remain reproducible later?
Maintenance
Who will review API changes?
How will updates be tested?
Which systems will depend on this connection?
How much recurring work will it require?
These questions help reveal the full cost before the integration reaches production.
How to migrate without stopping the program
Teams do not need to replace every integration at once.
The transition can happen in stages.
One. Create an inventory
Document every integration, the metrics it provides, the systems that depend on it, its owner, and its most common issues.
Two. Define a shared structure
Establish how the program will represent its main metrics, regardless of the source.
This structure should guide dashboards, alerts, and reports.
Three. Separate sources from internal systems
Reduce direct connections between providers and data consumers.
The goal is to prevent every new source from requiring separate connections to the application, dashboards, alerts, and reports.
Four. Centralize quality and monitoring
Apply shared rules for validating data, identifying gaps, and reviewing errors.
A central view helps teams detect problems before they affect more participants.
Five. Migrate by priority
Start with the integrations that:
Require the most maintenance
Generate the most support tickets
Affect the most participants
Show the most variability
Have the most internal dependencies
The easiest integration is not always the best place to start.
Start with the one creating the most work.
For programs connecting this data to clinical processes, read how to integrate wearables into clinical workflows.

When a direct integration still makes sense
The conclusion is not that programs should avoid every point-to-point integration.
A direct connection may still be appropriate when:
The program uses one source.
The scope is limited to a pilot.
The integration does not support critical workflows.
The data is not used in formal reporting.
The goal is to validate a hypothesis.
The source already uses a standard that matches the current system.
Replacing the integration would cost more than maintaining it.
The decision should consider the full integration lifecycle.
A direct connection can be an efficient way to test an idea. The risk appears when it becomes the permanent foundation of a program that needs to grow.
From connecting sources to building a sustainable foundation
The hidden cost of point-to-point integrations is not limited to the initial code.
It also appears in maintenance, support, normalization, reporting, and the dependencies that build up over time.
For an ACCESS program, growth is not only about connecting more devices.
It is about adding new sources without losing consistency, operational visibility, or confidence in the results.
At ROOK, we help teams connect, normalize, and deliver health data from more than 400 devices and platforms through one infrastructure.
This allows programs to build workflows and reports on structured data instead of maintaining a separate integration for every source.
Evaluating another integration for your program?Learn how ROOK can help simplify your health data infrastructure.